Notes
Matplotlib
Matplotlib is a python library used for graphing things out.
![]()
import matplotlib.pyplot as plt
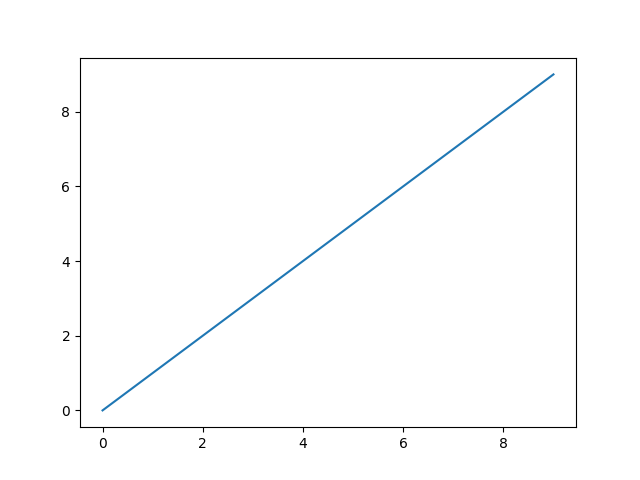
Line Graph
x=[i for i in range(10)]
y=[i for i in range(10)]

plt.plot(x,y)
plt.show()
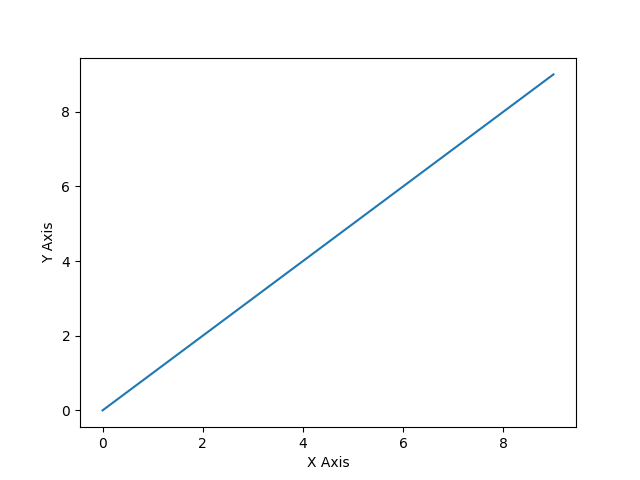
Adding Labels
x=[i for i in range(10)]
y=[i for i in range(10)]

plt.plot(x,y)

plt.xlabel('X Axis')
plt.ylabel('Y Axis')

plt.show()
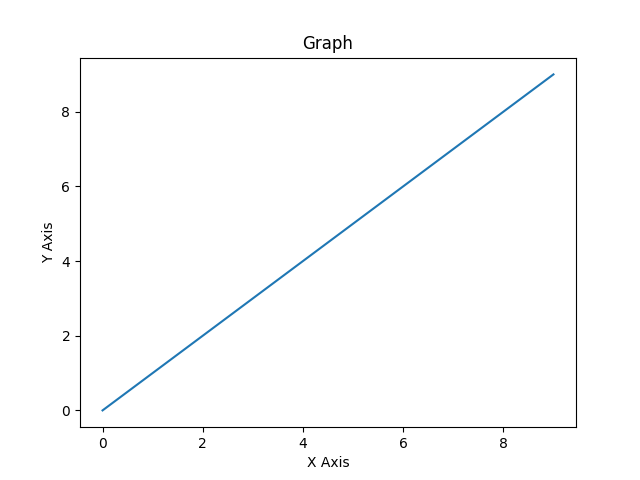
Adding Title
x=[i for i in range(10)]
y=[i for i in range(10)]

plt.plot(x,y)

plt.xlabel('X Axis')
plt.ylabel('Y Axis')

plt.title('Graph')

plt.show()
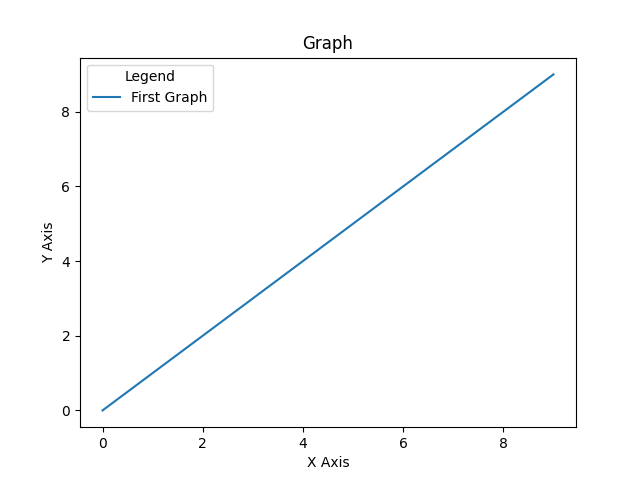
Adding Legends
x=[i for i in range(10)]
y=[i for i in range(10)]

plt.plot(x,y)

plt.legend(['First Graph'],title='Legend')

plt.xlabel('X Axis')
plt.ylabel('Y Axis')

plt.title('Graph')

plt.show()
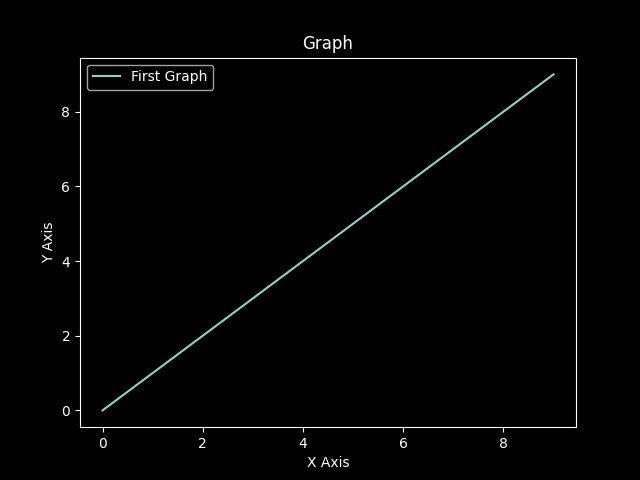
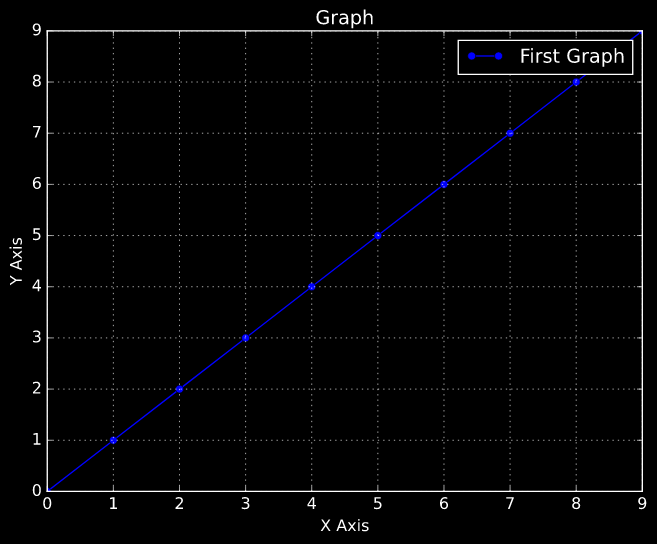
Styling Graphs
x=[i for i in range(10)]
y=[i for i in range(10)]

plt.style.use('dark_background')

plt.plot(x,y)

plt.legend(['First Graph'])

plt.xlabel('X Axis')
plt.ylabel('Y Axis')

plt.title('Graph')

plt.show()
List of Available Styles
plt.style.available

#Output: ['Solarize_Light2', '_classic_test_patch', 'bmh', 'classic', 'dark_background', 'fast', 'fivethirtyeight', 'ggplot', 'grayscale', 'seaborn', 'seaborn-bright', 'seaborn-colorblind', 'seaborn-dark', 'seaborn-dark-palette', 'seaborn-darkgrid', 'seaborn-deep', 'seaborn-muted', 'seaborn-notebook', 'seaborn-paper', 'seaborn-pastel', 'seaborn-poster', 'seaborn-talk', 'seaborn-ticks', 'seaborn-white', 'seaborn-whitegrid', 'tableau-colorblind10']
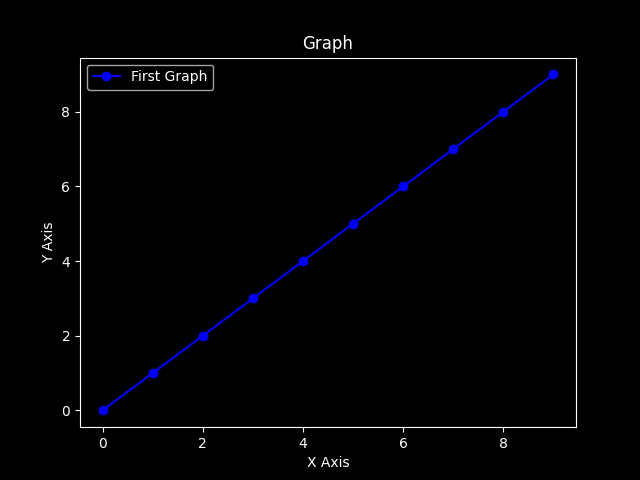
Setting Point Styles
x=[i for i in range(10)]
y=[i for i in range(10)]

plt.style.use('dark_background')

plt.plot(x,y,'b-o')

plt.legend(['First Graph'])

plt.xlabel('X Axis')
plt.ylabel('Y Axis')

plt.title('Graph')

plt.show()
Adding Grids
x=[i for i in range(10)]
y=[i for i in range(10)]

plt.style.use('dark_background')

plt.plot(x,y,'b-o')

plt.legend(['First Graph'])

plt.xlabel('X Axis')
plt.ylabel('Y Axis')

plt.title('Graph')

plt.grid()

plt.show()

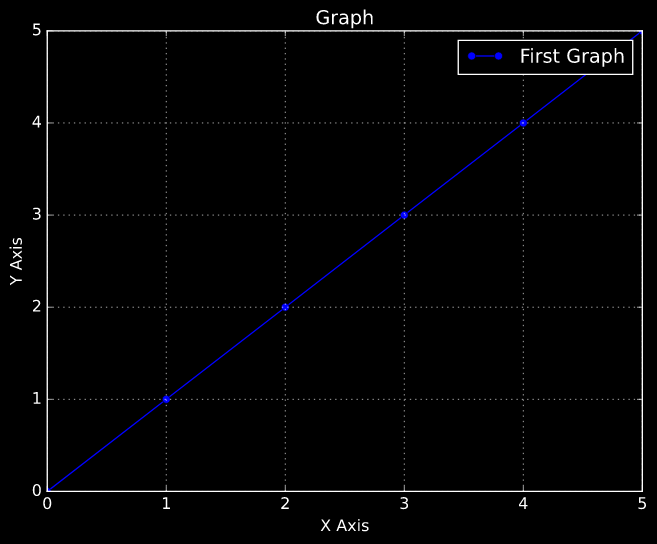
Adding Limits
x=[i for i in range(10)]
y=[i for i in range(10)]

plt.style.use('dark_background')

plt.plot(x,y,'b-o')

plt.legend(['First Graph'])

plt.xlabel('X Axis')
plt.ylabel('Y Axis')

plt.xlim(0,5)
plt.ylim(0,5)

plt.title('Graph')

plt.grid()

plt.show()
Tight Axis
x=[i for i in range(10)]
y=[i for i in range(10)]

plt.style.use('dark_background')

plt.plot(x,y,'b-o')

plt.legend(['First Graph'])

plt.xlabel('X Axis')
plt.ylabel('Y Axis')

plt.title('Graph')

plt.axis('tight')

plt.grid()

plt.show()
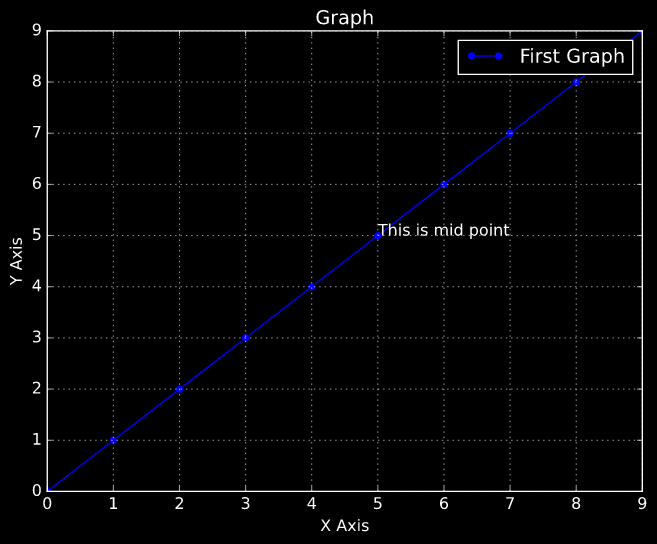
Labelling Points
x=[i for i in range(10)]
y=[i for i in range(10)]

plt.style.use('dark_background')

plt.plot(x,y,'b-o')

plt.legend(['First Graph'])

plt.xlabel('X Axis')
plt.ylabel('Y Axis')

plt.annotate('This is mid point',(5,5))

plt.title('Graph')

plt.axis('tight')

plt.grid()

plt.show()
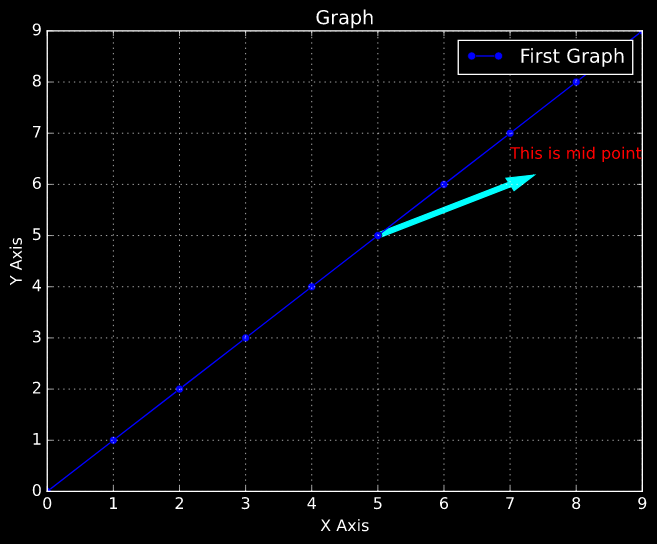
Putting Arrows
Syntax
plt.arrow(x,y,x_width,y_width)
Example:
x=[i for i in range(10)]
y=[i for i in range(10)]

plt.plot(x,y,'b-o')

plt.legend(['First Graph'])

plt.xlabel('X Axis')
plt.ylabel('Y Axis')

plt.arrow(5,5,2,1,width=.09,color='cyan')

plt.annotate('This is mid point',(7,6.5),color='red')

plt.title('Graph')

plt.axis('tight')

plt.grid()

plt.show()
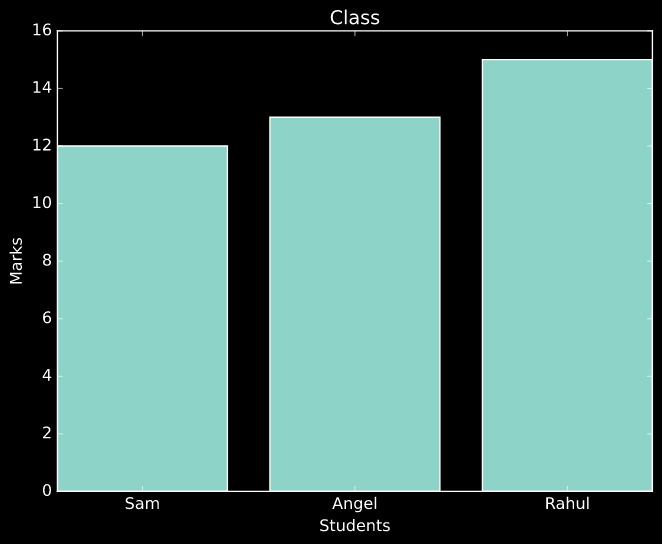
Bar Graph
x=['Sam','Angel','Rahul']
y=[12,13,15]

plt.bar(x,y)

plt.xlabel('Students')
plt.ylabel('Marks')
plt.title('Class')

plt.show()
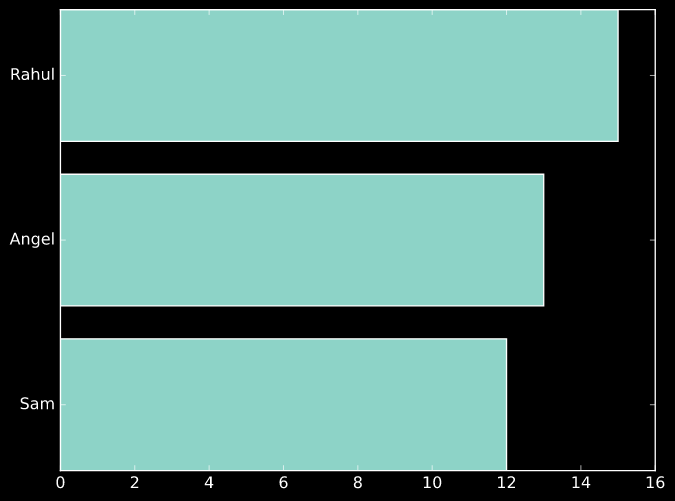
Horizontal Bar Graph
plt.barh(x,y)
plt.show()
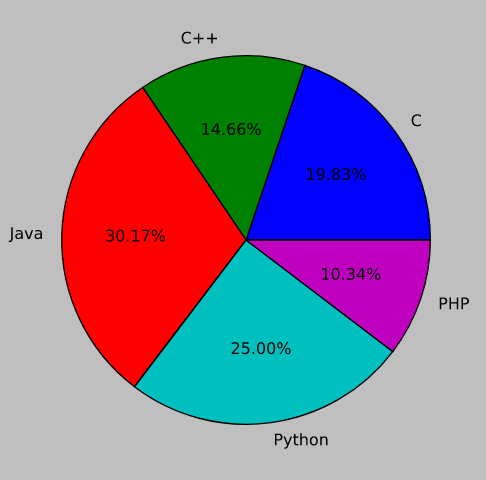
Pie Charts
langs = ['C', 'C++', 'Java', 'Python', 'PHP']
students = [23,17,35,29,12]

plt.style.use('classic')

plt.pie(students,labels=langs,autopct='%1.2f%%')

plt.show()
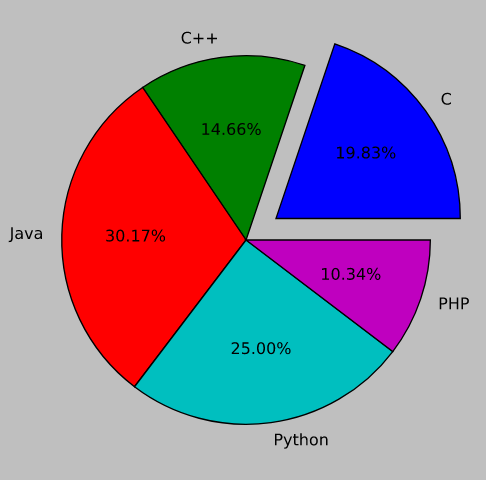
Explode
langs = ['C', 'C++', 'Java', 'Python', 'PHP']
students = [23,17,35,29,12]

plt.pie(students,labels=langs,autopct='%1.2f%%',explode=[.2,0,0,0,0])

plt.show()
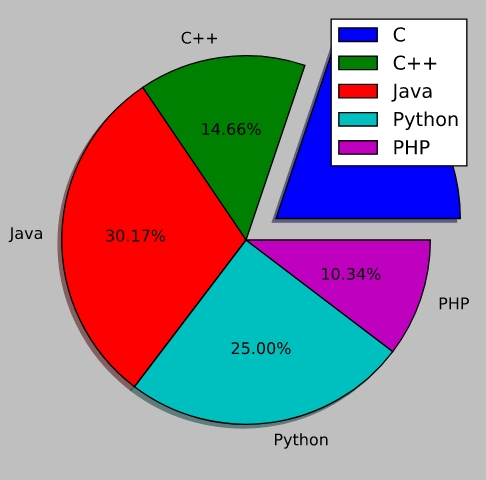
Legends
plt.style.use('classic')

langs = ['C', 'C++', 'Java', 'Python', 'PHP']
students = [23,17,35,29,12]

plt.pie(students,labels=langs,autopct='%1.2f%%',explode=[.2,0,0,0,0],shadow=True)

plt.legend()

plt.show()